The JOBO CPE2 is a useful reference for Panterla: a compact water bath, thermostatic heating, and a motor-driven processing drum. After measuring the THD Lift, I wanted to ask the same thermal questions of another machine and then follow the liquid into the drum itself.
On 25 September 2026, five temperature channels recorded a 55.35-minute warm-up, a separate 20-minute observation, and a 5.45-minute solution-transfer test. No auxiliary circulation pump was running during the reported bath-temperature measurements.
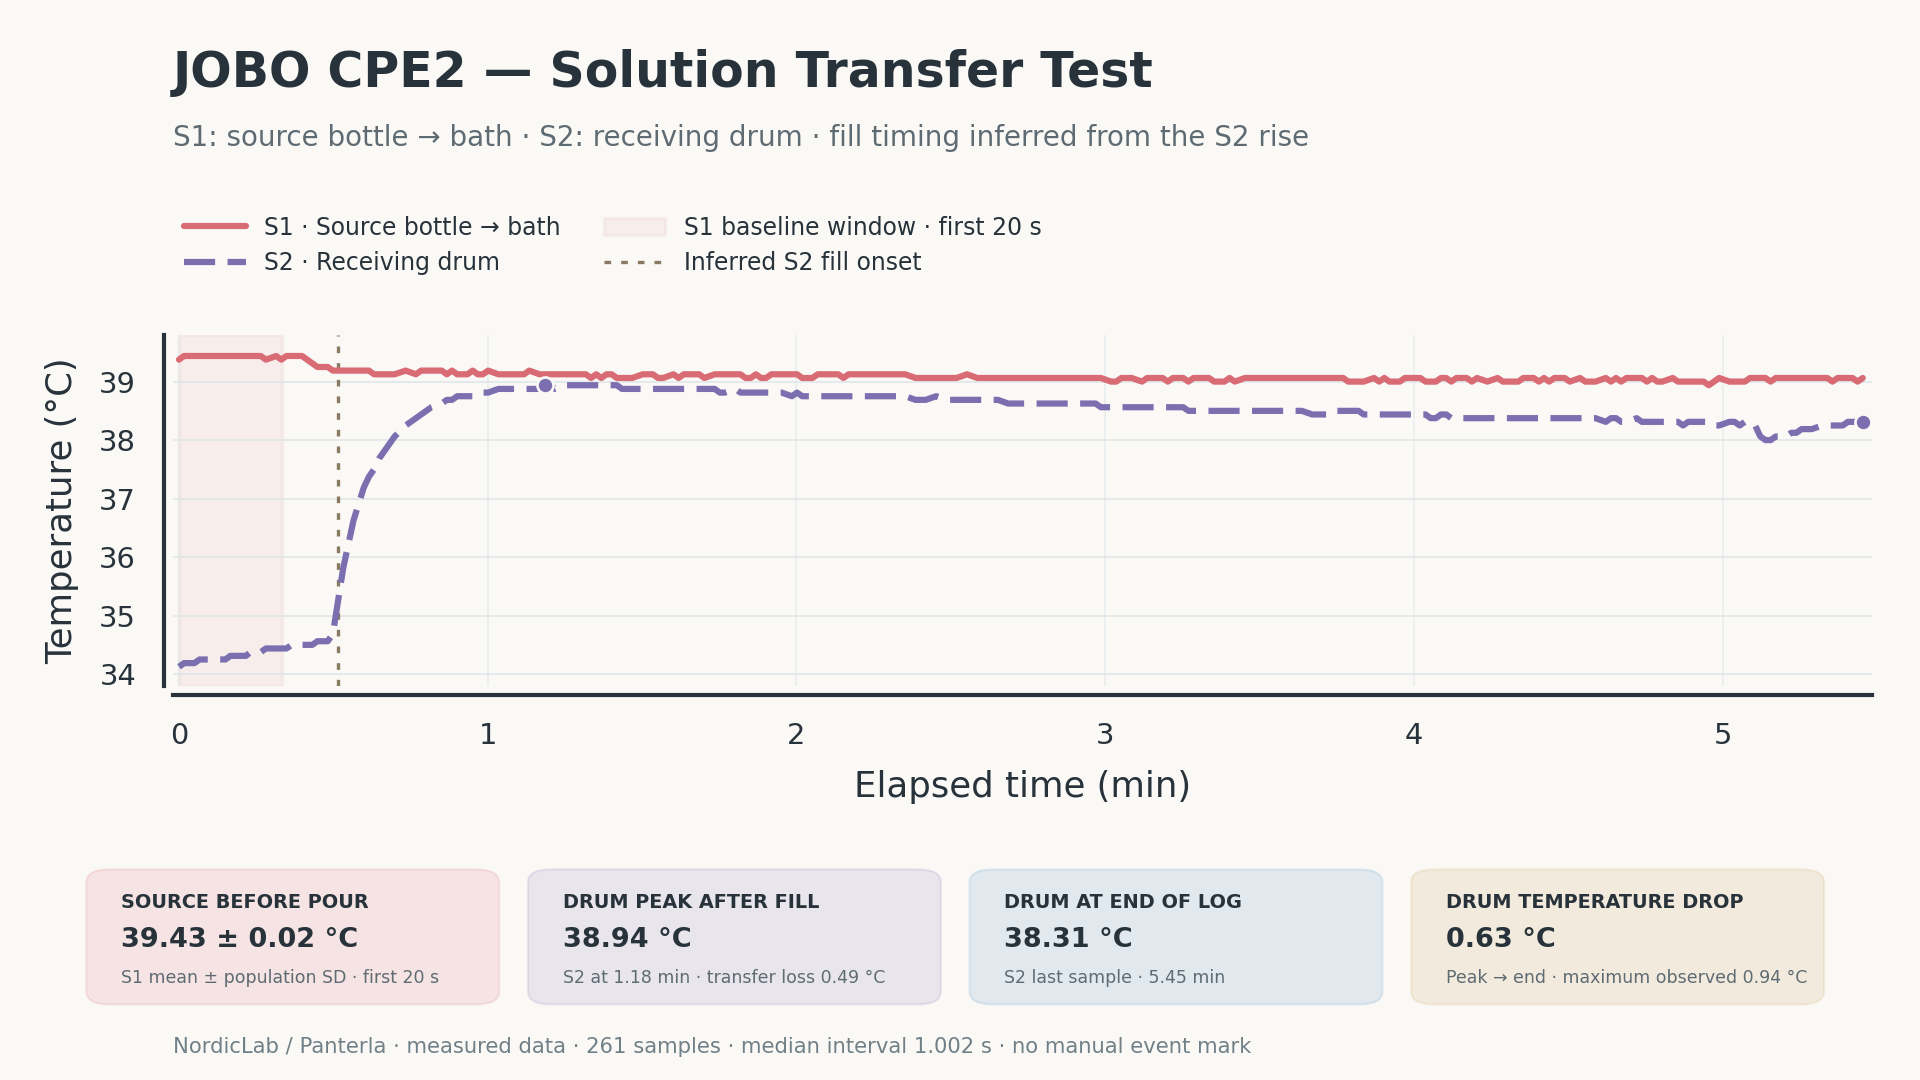
The recorded external readings differed by 2.266°C on average during the 20-minute window. Some individual channels were locally steady, but several were still warming. In the transfer record, the receiving drum reached 38.938°C and ended 0.626°C below that peak. These are temperature measurements from one configuration, not a film-processing acceptance test or a verdict on every CPE2.
Setup and what the channels measured
The bottle-and-cylinder frame was installed in the bath. The old plastic frame was damaged and awkward to fit, making repeatable container and probe positions a mechanical issue as well as a thermal one. One bottle occupied an upper position chosen to resemble the earlier CP Lift geometry.
| Channel | Warm-up and stability position |
|---|---|
| S1 | Inside the bottle |
| S2 | Heated platform |
| S3 | Bath above the heater |
| S4 | Measuring-cylinder area |
| S5 | Far corner |
S2–S5 are called the external locations. Their arithmetic mean is descriptive; it is not a volumetric bath average. Exact immersion depths, coordinates, liquid volumes, and channel corrections were not recorded. Without a common-temperature calibration record, differences between these readings include unknown probe offsets.
The heater was initially switched on with the thermostat at maximum. The operator later turned it down until the indicator went out. The knob setting, heater switching, and controller setpoint were not synchronized with the CSV. The 39°C line in the heating figure is an analysis reference, not a logged setpoint or recommended chemistry temperature.
Warm-up: one location gets there before another
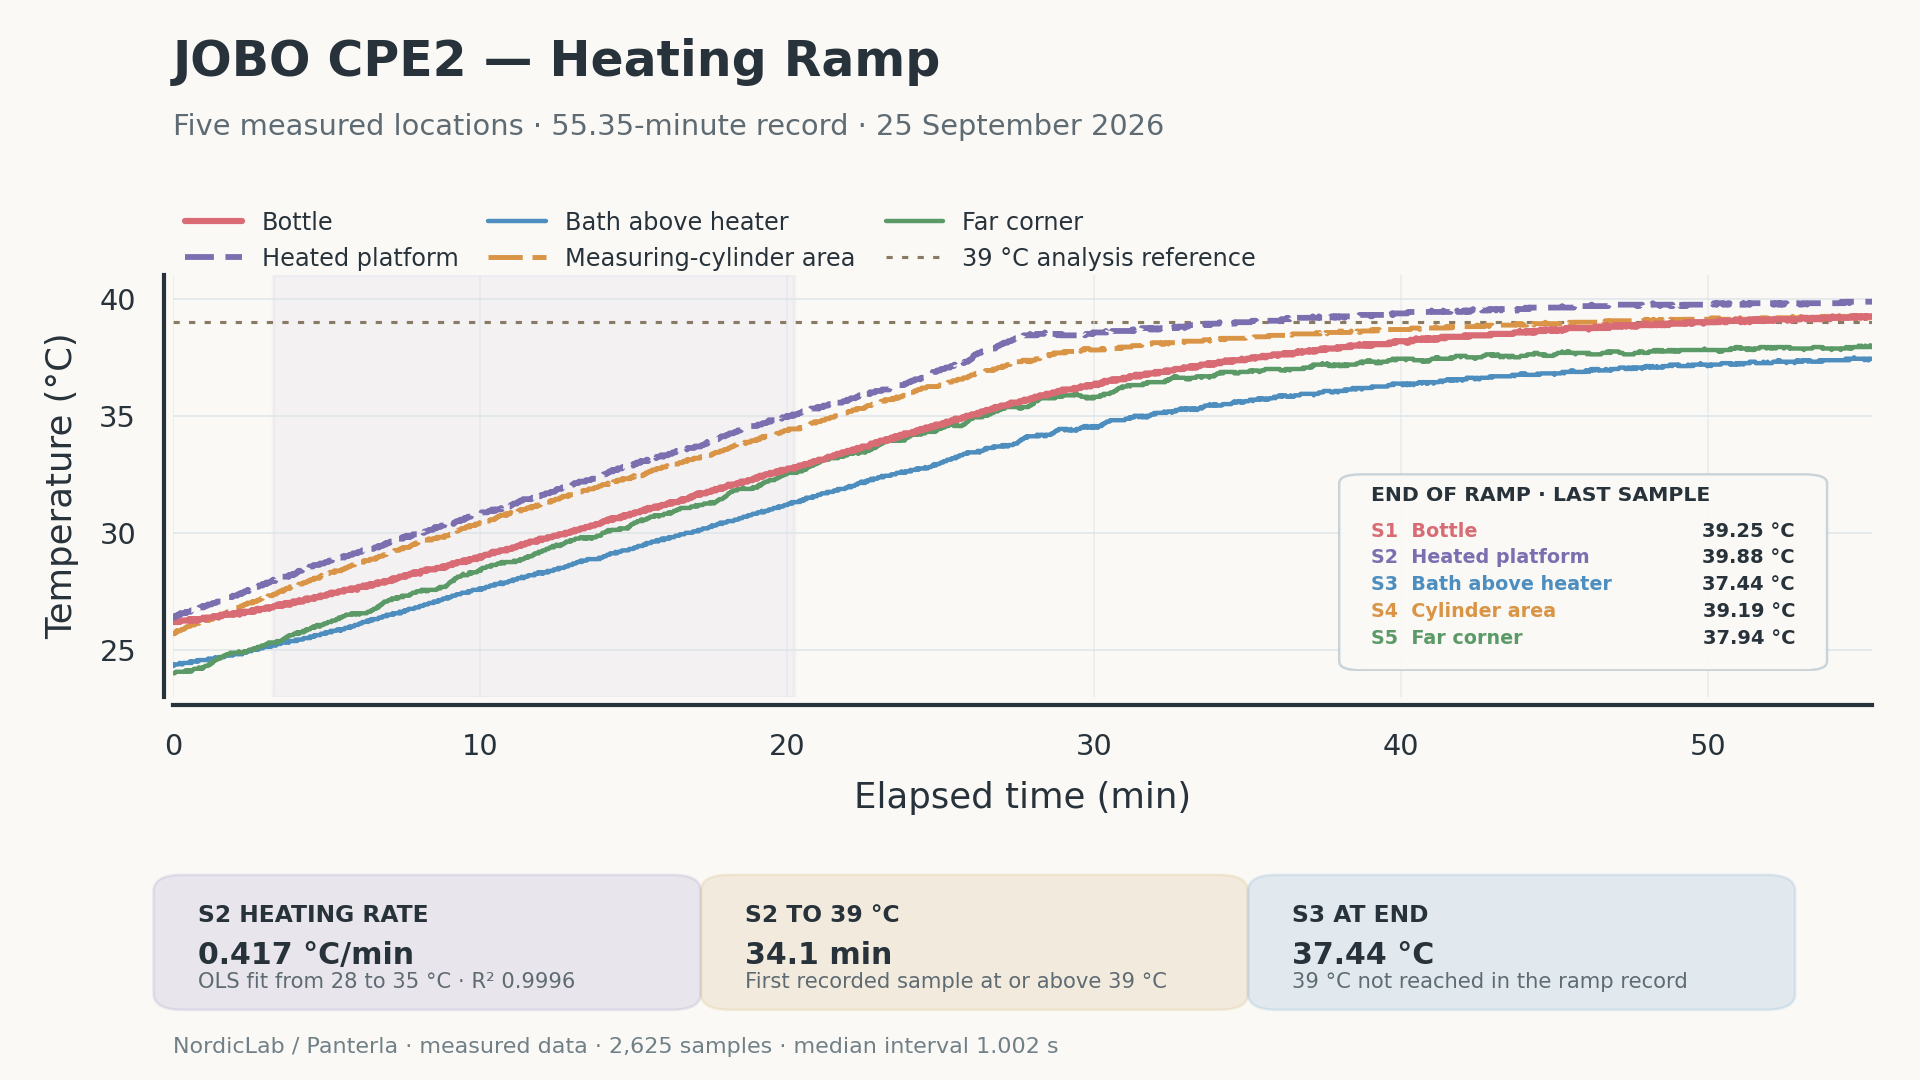 Each trace belongs to a different measurement location. This graph ends with the warm-up file and does not connect across the gap to the stability record.
| Location | Rate over 28–35°C | First recorded ≥38°C | Final two-minute mean |
|---|---|---|---|
| S1 — Bottle | 0.375°C/min | 38.30 min | 39.206°C |
| S2 — Heated platform | 0.417°C/min | 26.88 min | 39.845°C |
| S3 — Bath above heater | 0.353°C/min | Not reached | 37.397°C |
| S4 — Measuring-cylinder area | 0.405°C/min | 31.25 min | 39.209°C |
| S5 — Far corner | 0.407°C/min | 54.92 min | 37.912°C |
The platform crossed 38°C 11.43 minutes before the bottle and 27.43 minutes before the far corner. S3 never reached that reference in the 55.35-minute log despite its described position above the heater.
That last result is counterintuitive, but the traces cannot identify its cause. Depth, local circulation, mounting, and probe offset are all possible contributions. The initial recorded temperatures also differed by 2.375°C, so crossing times reflect different starting conditions as well as heating behavior.
The approximately 0.35–0.42°C/min central fits support the video’s rough 0.4°C/min estimate. They do not describe the slower approach to the final temperature or establish electrical heater power.
Locally steady readings do not establish a uniform bath
The second file starts 19.017 seconds after the warm-up ends. It contains 982 samples over 20.00 minutes.
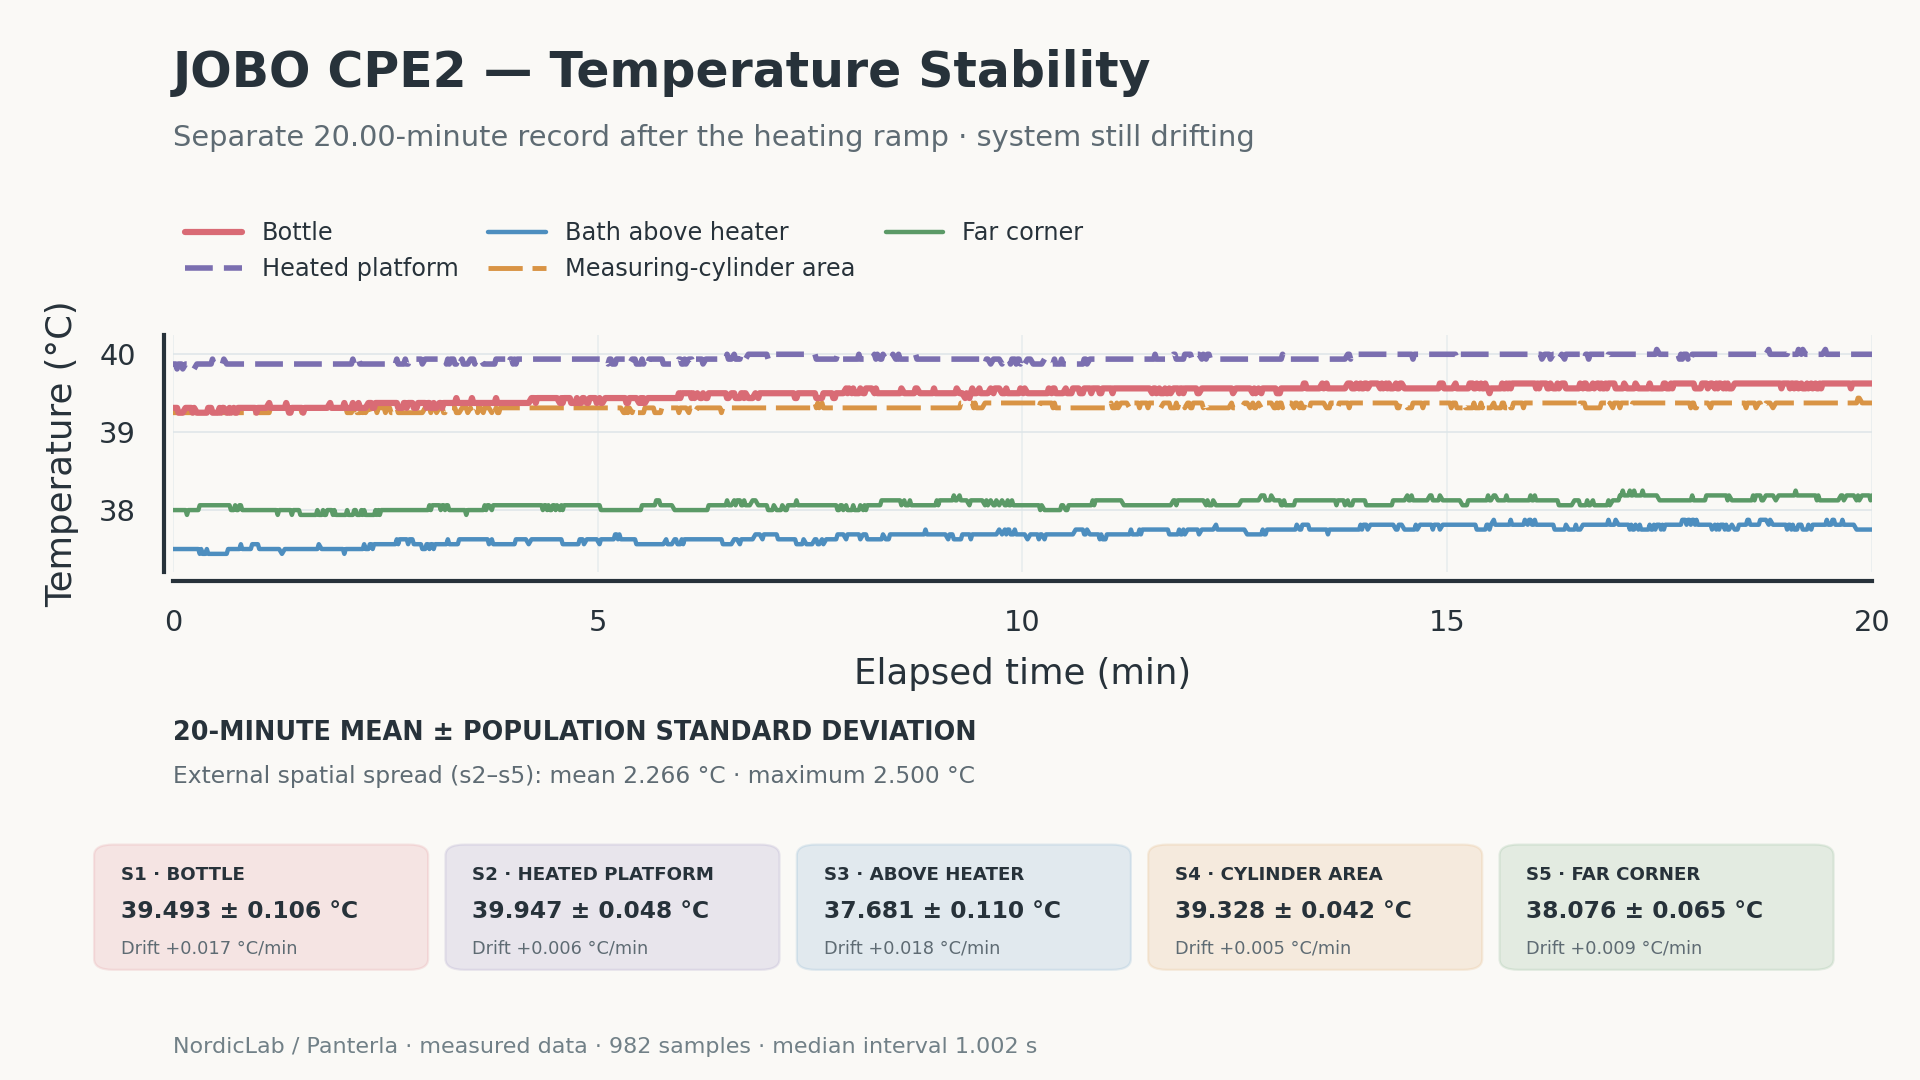 Mean ± SD describes recorded variation at each point. Unknown channel offsets remain part of the differences between locations.
| Location | Full-window mean ± SD | Fitted drift | Final five-minute mean ± SD |
|---|---|---|---|
| S1 — Bottle | 39.493 ± 0.106°C | +0.0167°C/min | 39.597 ± 0.032°C |
| S2 — Heated platform | 39.947 ± 0.048°C | +0.0064°C/min | 39.999 ± 0.017°C |
| S3 — Bath above heater | 37.681 ± 0.110°C | +0.0175°C/min | 37.803 ± 0.036°C |
| S4 — Measuring-cylinder area | 39.328 ± 0.042°C | +0.0055°C/min | 39.362 ± 0.027°C |
| S5 — Far corner | 38.076 ± 0.065°C | +0.0089°C/min | 38.142 ± 0.043°C |
S2 was the hottest external reading and S3 the coldest in every sample. The instantaneous S2–S5 spread had a 2.266°C mean, 2.376°C 95th percentile, and 2.500°C maximum. This is a spread of recorded locations, including any unmeasured channel offsets, rather than a calibrated map of the physical bath gradient alone.
The bottle and S3 fitted trends rose by approximately 0.33–0.35°C over the complete window. The small final-five-minute SDs therefore do not make the earlier 20 minutes a settled equilibrium test. Nor do they identify thermostat hysteresis: heater on/off state was not recorded.
The useful distinction is between short-term repeatability at one location, differences between locations, and the temperature actually experienced by the process liquid. All three need their own measurements.
Following the solution into the rotating drum
The magnetic coupling allowed a probe lead to reach the receiving drum during the third test. The drum initially rotated above the bath surface, so warm water was added until its exterior contacted the bath. The video describes about five minutes of intended preheat; its exact timing and thermal condition were not logged.
S2 measures the receiving drum in this file. S1 starts in the source bottle and is moved into the bath after the pour. The later S1 trace no longer represents the source solution. The automatic captions once mention S5 as the drum probe, but later narration and the large S2 fill response support the S2 assignment used here.
 The first 20 seconds provide the S1 baseline. The vertical fill marker is inferred from the S2 rise; no synchronized manual event mark was recorded.
| Quantity | Recorded or calculated result |
|---|---|
| S1 source before pour, first 20 s | 39.427 ± 0.024°C |
| Inferred S2 fill onset | 0.515 min |
| S2 drum peak | 38.938°C at 1.185 min |
| Apparent source-to-peak difference | 0.489°C |
| S2 at end of log | 38.312°C at 5.454 min |
| Drum peak-to-end drop | 0.626°C over 4.269 min |
| Deepest observed post-peak drop | 0.938°C, reaching 38.000°C |
The drum began near 34.1°C, warmed rapidly as liquid arrived, and then cooled. It partially recovered after the deepest dip, but had not demonstrated a settled plateau when logging stopped.
The 0.489°C source-to-peak difference is an apparent transfer loss. It includes unknown S1/S2 offsets and sensor response, so it is not a calibrated measurement of liquid heat loss. The 0.626°C peak-to-end drop stays within S2 and spans 4.269 minutes after the peak; it is not a measurement over a complete photographic development step.
Drum-wall heat absorption, residual liquid, bath contact, evaporation, and probe response may all contribute. The experiment does not isolate them. It does show why an elapsed preheat time is incomplete without bath level, rotation, drum loading, and a measured readiness condition.
What the manufacturer instructions say
The original English JOBO CPE-2 Plus instructions carry ©1997; the project preserves the 2013 archived PDF. Relevant page numbers below count PDF pages from the cover. The former manufacturer archive currently returns an untrusted TLS certificate, so this article cites the preserved document rather than directing readers to that download.
- PDF page 14: check temperature in a bottle or graduate rather than treating bath temperature or drained effluent as process temperature.
- PDF page 15: bathe the rotating drum approximately 3–6 mm above its bottom, without allowing it to float. The initial lack of exterior bath contact in this test therefore matters.
- PDF pages 51–52: distinguish the original CPE2 from the Plus. The original model has different drive hardware and a 600 ml maximum tank charge. The thermal-overload device is listed among Plus-version additions; it must not be assumed for this specimen.
The manual’s guidance that stabilized bottle and drum temperatures agree concerns the prescribed setup. It is not a measured result of this test.
The historical Kodak FLEXICOLOR rotary-process reference, PDF pages 6–7 (printed 3-6–3-7), specifies 37.8 ± 0.15°C during developer processing and uses control strips to determine temperature-loss compensation. Those instructions apply to the documented FLEXICOLOR process, not every current C-41 kit or E-6. The 39°C figure reference and a hypothetical 40°C comparison do not replace a chemistry manufacturer’s process conditions.
A separate heater-resistance measurement
On 28 September, the owner reported 117 Ω for the CPE2 heater. Applying P = V²/R gives approximately 414 W at 220 V or 452 W at 230 V, with calculated currents of 1.88 A and 1.97 A respectively.
That measurement was made after the temperature experiment. Meter details, isolation, element temperature, actual mains voltage, and operating current were not recorded. These are conditional electrical calculations, not measured input during the logged run or a confirmed factory rating.
What this adds to Panterla
The strongest design requirement is readiness at the process location. A locally steady heater-side reading is insufficient when another container is still warming or a drum loses temperature after filling.
The next comparison should keep geometry and channel corrections fixed, then test controlled circulation with and without a pump. A rigid, replaceable bottle frame and documented probe mounting make that comparison reproducible. The proposed pump placement is a modification to test, not a benefit already demonstrated by this run.
The direct-heating prototype addresses the same lag from another direction. Its smaller water volume, direct sensor access, and circulation are promising, but its warm-up rate cannot be treated as a controlled efficiency comparison with either full-size processor. Heat source, liquid mass, vessel, and measurement windows differ.
The drum-drive study also needs to retain this thermal geometry: correct shaft support and bath contact, repeatable rotation under liquid load, and a preheat sequence that brings the actual drum to its required condition.
Data quality and remaining measurements
The three files contain 2,625 ramp samples, 982 stability samples, and 261 transfer samples. Median adjacent intervals are 1.002 s, while sample-count rates are approximately 0.790, 0.817, and 0.795 Hz. Missing sequence counts are 694, 218, and 67. The counter’s meaning is undocumented; skipped values do not by themselves identify the recording failure mechanism.
No film or sensitometric control strip was processed. This dataset therefore does not prove that the machine succeeds or fails a particular C-41 or E-6 recipe. It documents differences between recorded locations, continuing drift, and a receiving-drum temperature change that require further characterization.
The next test needs one uninterrupted record, common-temperature probe checks before and after, synchronized pour and thermostat events, measured bath and drum volumes, water level, rotation speed, ambient temperature, and heater/pump state. Repeat matched configurations at least three times. Define allowable deviation and drift from the selected chemistry’s requirements.
Download and reproduce
The temperature experiment bundle contains the six raw CSV files for both processors, their saved summaries, hash manifest, and an independent Python standard-library verifier. The 1 October review reproduced 189 saved metrics with zero mismatches across 6,348 observations.
The JOBO review also corrected the derived final-five-minute fitted_change_c values to use the actual window duration. Means, SDs, slopes, and the tables above were unaffected. The revised publication figures use the reviewed data. Original observations remain unchanged.
For the earlier machine, see the THD Lift warm-up and stability plus teardown. They share a logging approach, but concern a different processor and probe geometry; their datasets remain separate.